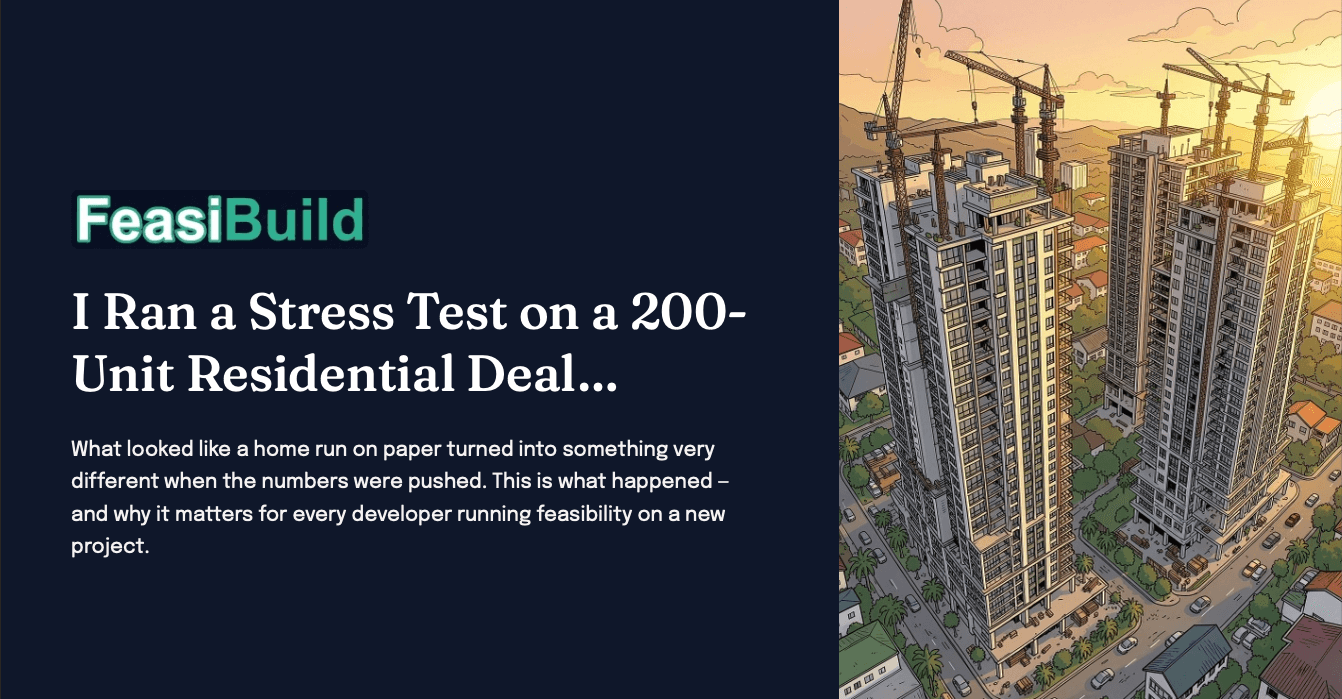
I Ran a Stress Test on a 200-Unit Residential Deal — Here's What Happened
What looked like a home run on paper turned into something very different when the numbers were pushed. This is what happened — and why it matters for every developer running feasibility on a new project.
The Base Case: 18% IRR. Looks Like a Home Run.
A 200-unit residential project in Malaysia. On paper, the assumptions were aggressive but believable — strong sales velocity, fat margins, clean returns.
- 200 units — residential development
- 18% base IRR — projected return on equity
- 5% price drop — the stress scenario trigger
The Question Nobody Asks: What If the Market Softens Right at Launch?
Most feasibility models stop at the base case. The real risk hides in the assumptions that feel safe — until they're not. Two variables were stress-tested simultaneously:
- Selling price −5% — market softens just as the sales gallery opens
- Construction costs +5% — material and labor inflation hits mid-build
The Tornado Chart: Mapping the Exact Risk Vectors
A tornado chart ranks risk factors by impact — showing which assumptions move the needle most. In this case, selling price sensitivity dominated, with construction cost inflation compounding the damage: price −5% alone dragged IRR to 13%; costs +5% alone to 15% — against the 18% base case as the reference line.
This is the difference between a back-of-the-napkin model and an institutional-grade feasibility study. You don't just calculate the upside — you map the landmines.
The Shock: IRR Collapsed from 18% to 4.2%
The profit margin vanished. The developer was essentially working for free — generating just enough to cover the bank's interest.
- Base case: 18% IRR — strong returns, attractive to equity partners
- Stress case: 4.2% IRR — margin evaporated, project barely covers debt service
- The gap: 13.8 points — wiped out by two 5% assumption shifts
It Doesn't Just Break the Math — It Writes the Advisory
FeasiBuild didn't output a broken spreadsheet. The AI generated a 2-page scenario analysis & IRR sensitivity — explaining exactly the factors why the project was vulnerable and what to do about it.
- Diagnosed the vulnerability — identified price sensitivity as the primary risk driver
- Recommended a fix — build a 10% contingency into the equity stack
- Institutional-grade output — ready to share with lenders, partners, and stakeholders
Run your own stress test before the market runs it for you — first scenario free on the Explorer tier. feasibuild.app
Slide deck
Download the slide deck (PDF)Run this analysis yourself — first report free at feasibuild.app
Start your first reportRelated posts
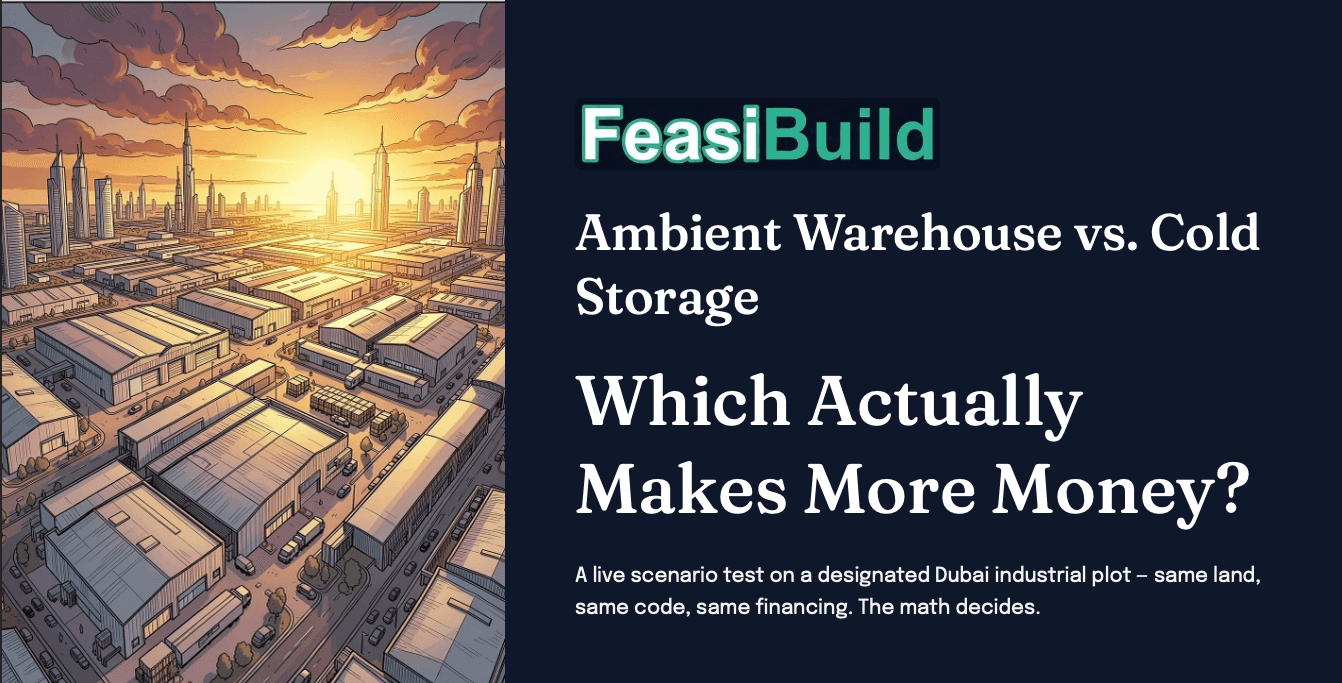
Ambient Warehouse vs. Cold Storage: Which Actually Makes More Money?
A live scenario test on a designated Dubai industrial plot — same land, same building code, same financing. Only the product format changed. The math decided.
19 Oct 2026 • 2 min read

How agents win landowner mandates in 2026
The market has shifted. The agents who close exclusive mandates aren’t the ones with the flashiest decks — they’re the ones who walk in with numbers on the table.
22 Aug 2026 • 6 min read

Seven Escrow Regimes. One Cashflow Engine.
How FeasiBuild models off-plan buyer-payment rules natively — from Dubai's Law No. 8 to India's RERA 70/30. One engine. Every jurisdiction.
19 Oct 2026 • 3 min read